Poll

Charty McCharterson
Charty McCharterson

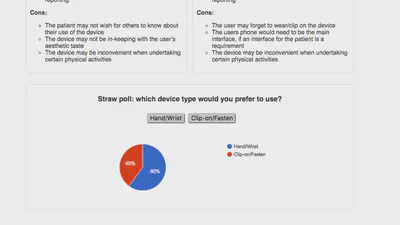
I knew that all of that work that I did on polls would come in handy at some point. The time arrived, as displaying data was something that seemed important from the beginning, to support the goals for the project. I wanted to support the information about ‘UK smart device ownership’ with some data. Having spent quite a bit of time looking at polling options and trying things out, I felt sure that the the Google Charts api (n.d.) would give me the level of interactivity and customisation required.

7 Jan, 2017

On the importance of self-discipline

Update on the previously mentioned to-do list: concept document Task scenarios Now at version 3 to reflect the decision to present all of the content on one long page. Business Model Canvas General characteristics for user groups - I went a bit more in-depth and produced a user characteristics list for the primary user group of health professionals - direct link to the Google doc \[Tentative plan\] create a UML diagram - I am not going to do this, as it is primarily a tool to communicate with developers and as I am UXer and developer here I think that it is more important for me to crack on with the development (although if I had been more self-disciplined and followed a UML I probably could have avoided the feature creep outlined below). An paper online prototype – in the end this was a prototype version of the actual site. Delivered to Dr. Theo Fotis on the 12th of December. Adding polling aka feature creep 16/12 - 24/12 In my last post I mentioned that I had decided to add a poll as I felt that some further interaction might be needed. I now realise that really a bit of a superfluous feature and upon reflection I have spent too much time on it.

24 Dec, 2016